
the normalization algorithm for M.A.N.
(microarray analysis and normalization)

|
|
|
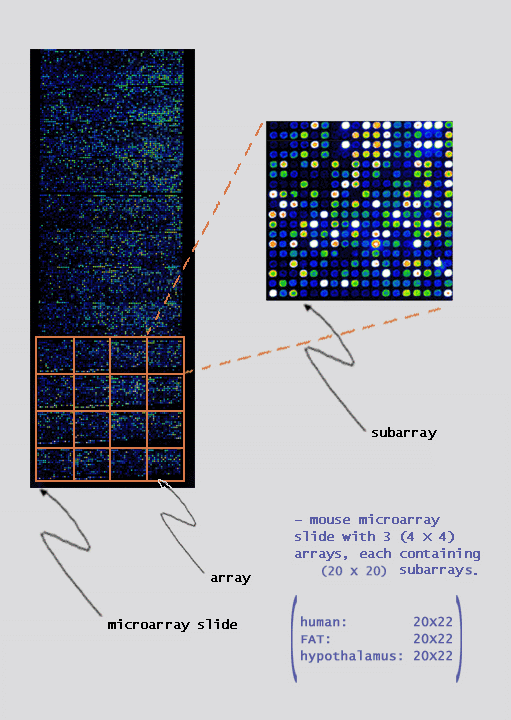
the normalization algorithm for M.A.N. (microarray analysis and normalization) |
|
|
|
|
|
|
|
|
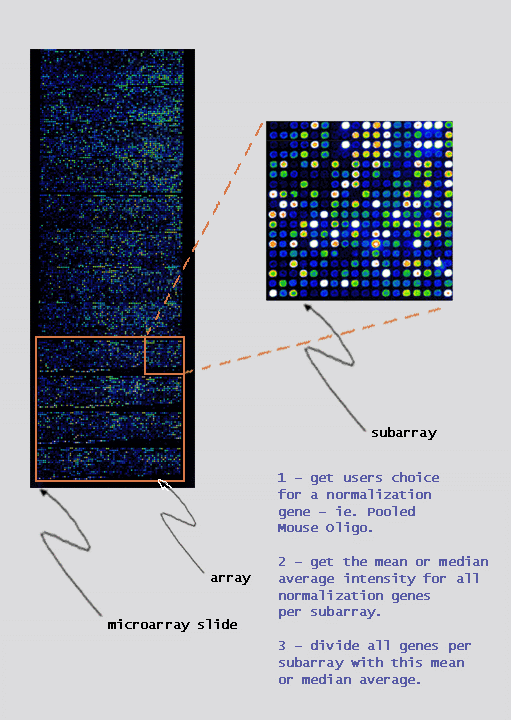
intensity of all genes per subarray: |
|
|
|
Below is a sample MA scatter plot of gene intensities after normalizing the subarrays to the users normalization preference. 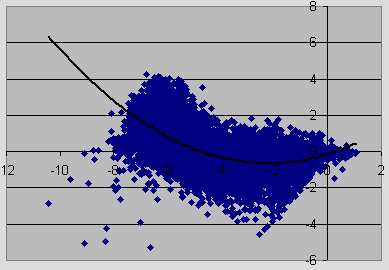
|
|
|
Next the sample MA scatter plot of gene intensities after normalizing the subarrays using lowess. 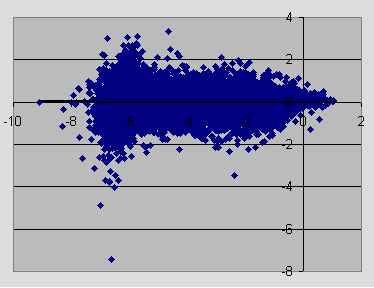
|
|
|
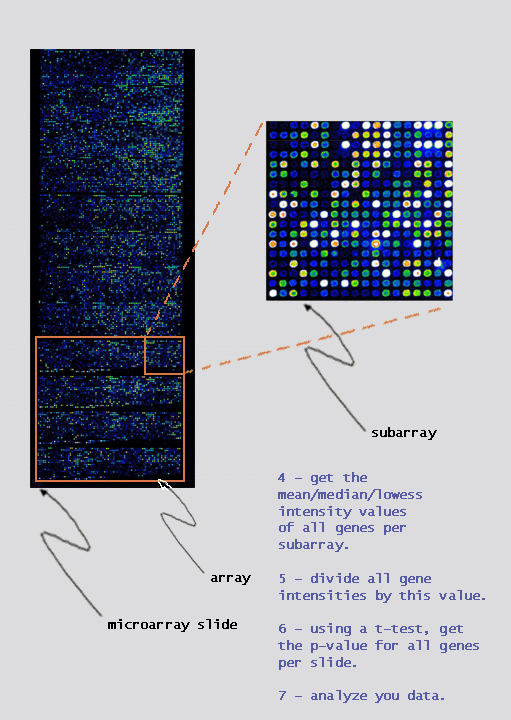
we can use a one-sided T-test to measure the distance (deviation) of the gene intensities from zero. This will produce more accurate p-values and allow users to determine which genes are up or down regulated. |
|
|