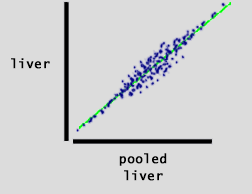
If the trend went downward rather than upwards, the correlation would be -0.9.
For perfect linearity, r = ±1.
If there is no linear trend at all--for example, if there is a random scatter of points--the value of r is close to zero. Points distributed evenly around a circle would also give a correlation of near zero, because there would be no overall linear trend.